Measurements
Last updated on 2025-03-21 | Edit this page
Overview
Questions
- How can I make useful measurements in my image?
Objectives
- Find the mean pixel intensity in each nucleus
- Find the area of each nucleus
Having isolated individual nuclei in the example image in the previous chapter, we can make some observations about the image features. The exercises here will require:
- Your masked watershed transformation from the previous chapter
- Your original smoothed image from exercise 9
Processing one nucleus at a time
Remember that each nucleus is labelled with a unique number, so we use masking to select a single nucleus. We can construct a binary mask from a labelled image using numpy’s where function:
PYTHON
from numpy import where

nucleus_1 = where(masked_watershed == 1, 1, 0)
nucleus_2 = where(masked_watershed == 2, 1, 0)
Here, each pixel will be set to either 1 or 0 depending on whether its value matches the label we’re looking for, effectively creating a binary mask for each nucleus.
Exercise 13: Quantifying intensities
For each labelled nucleus:
- Construct a binary mask matching the label number
- Use this to isolate the individual nucleus out of your
original smoothed image
- Hint: try looking at the
numpy.wheredocs to see the different ways it can be used.
- Hint: try looking at the
- Find the mean pixel value for the nucleus
First, we need to know how many features we’re looping over. We can get that from the numbers that the labelling process provides - if your labelled image contains the labels 1, 2 and 3, then you have 3 features.
Next, we need to generate a mask for that feature using
numpy.where, that will allow us to mask out the original
image - in this case, either a corresponding pixel value from the
original image or None. We can then take the result of
that, select all pixels that are not None and use
numpy.mean.
PYTHON
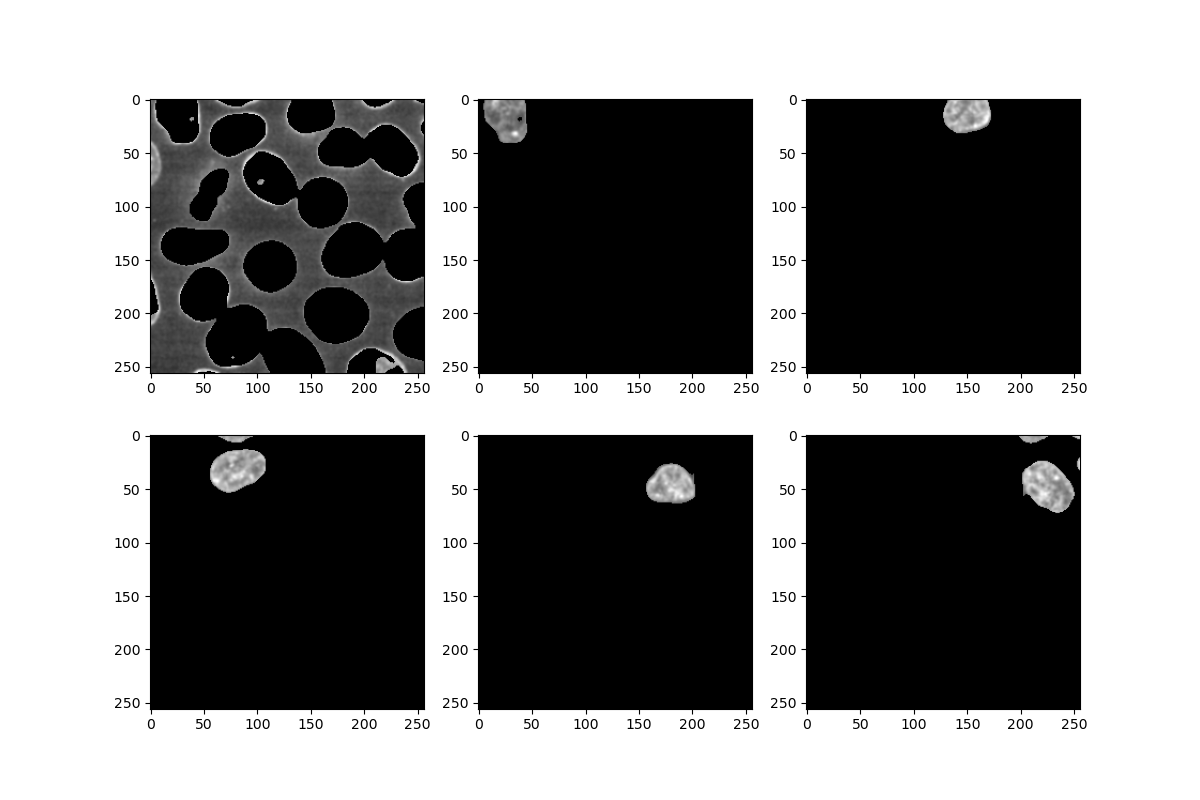
plt.figure(figsize=(12, 8))
labels = sorted(set(masked_watershed.flatten()))

for i in labels[:6]:  # just showing the first 6
    mask = numpy.where(masked_watershed == i, 1, 0)
    nucleus = numpy.where(mask == 1, image, 0)
    plt.subplot(2, 3, i + 1)  # subplot counts from 1 rather than 0
    plt.imshow(nucleus)
    pixels = [p for p in nucleus.flatten() if p]  # remove the background pixels
    print('Feature ' + str(i) + ':', numpy.mean(pixels))
A few notes:
- Note how the first feature labelled as
0corresponds to the background - Remember that in
subplot, we need to offset the subplot number by +1, since it counts from 1 - In the first
numpy.whereabove, we supply two single numbers, 1 and 0, giving us a binary mask. In the next one, we provide an n-dimensional array instead, causing it to instead select the value of the corresponding pixel.
- Binary multiplication and
numpy.whereare powerful ways of combining images and masks - The numbers assigned during labelling can be used to select and process one feature at a time
